Implications of EU tax regime on commercial operations of merchant vessels

SummaryAbstractIntroduction Methodology and Assumptions:Results and Discussion:ConclusionReferencesShare
-
Share
-
Abstract
The European Union has proposed and implemented polluter penalty mechanisms on commercial vessels visiting EU ports. The ‘EU Emission Trading Scheme’ and the ‘Fuel EU Maritime’ are two such mechanisms that impose penalties on vessels burning conventional fossil fuels. These regulations aim to increase the uptake of alternative fuels to reduce the overall carbon footprint of the shipping industry. This study analyses the commercial implications to Shipowners/Charterers in terms of the cost of generating compliance surpluses to adopt various alternative fuels currently available. The study also establishes the minimum fuel mix ratio that mitigates the tax liabilities for these fuels. The results show that the minimum cost of generating Surplus is significantly dependent on the cost difference between the alternative fuel and the fossil fuel. The results also conclude that Biodiesel costs the lowest to generate Surplus and this value is lower than the cost of abatement which makes pooling an attractive mechanism.
Keywords: EU tax, Fuel EU Maritime, EU ETS, Alternate fuels, Biofuels, Cost of Surplus, Mitigation fuel mix, GHG intensity, Marine fuels, Maritime emissions.
Introduction
The European Union has implemented the EU Emission Trading Scheme (EU ETS)1 from the year 2024 and has introduced the Fuel EU Maritime (FEUM)2 regulation from 2025 onwards. Both these regulations aim to impose monetary penalties on ships burning conventional fossil fuels trading within EU waters. The EU ETS targets tank-to-wake emissions, setting a penalty price for each unit of CO2 (MT CO2) emitted from the stack in EU waters. The penalty price, to be paid as EU Allowances (EUA’s), has a dynamic pricing structure and depends on the demand-supply principle. Furthermore, the quantum of EUA’s annually available for trade are capped progressively with time, thereby imposing low-emission shipping in EU. The phase-in of the regulation is controlled by the proportion of annual penalty owed to be surrendered, with 40% in 2024, 70% in 2025 and 100% from 2026 onwards. Thus, the additional burden on Ship-owner / Charterer / Ship-manager is directly proportional to the total EU emissions, the price of each EUA and the year of operation. Furthermore, the introduction of Methane and Nitrous oxide within the emission spectrum (MT CO2eq) from 2025 onwards will lead to increased penalties.
The FEUM regulation focuses on the effect of the greenhouse gas (GHG) intensity over the entire lifecycle (well-to-wake) of a given fuel. The EU commission has set out a target GHG intensity from the year 2025 to 2055. If the current mix of fuel used by a given vessel has a GHG intensity greater than the target GHG intensity, then that ship will have to pay a penalty proportional to this excess. This penalty is calculated based on a ‘compliance balance’ (CB), that is negative in case the fuel mix used has an GHG intensity greater than the target and vice versa. A negative CB is termed as ‘deficit’ and indicates a penalty is owed by the ship to the EU while a positive CB is called ‘Surplus’ which indicates the ship’s compliance to the regulation. When the Surplus is to mitigate the ‘deficit’ of the same ship in the future years this mechanism is termed as ‘banking’. When the Surplus is to mitigate the ‘deficit’ of other ships in the current year, this flexibility mechanism is termed as ‘pooling’.
A lower quantum of EUA’s and a Surplus can be generated if the vessel can burn sustainable fuels like biofuels blends or renewable fuels of non-biological origin (RFNBO’s). Biofuel blends include a mix of fossil fuels and sustainable biofuels (upto 30% blend does not require a NOC from engine manufacturer). RFNBO’s are alternative fuels like e-Methanol, e-LNG, etc. that are manufactured in a sustainable way so that the overall climate impact of this fuel is reduced significantly. However, biofuels and RFNBO’s are currently more expensive than conventional fossil fuels. Thus, including them in the existing fuel mix will increase the fuel bill. A vessel should also be equipped to burn these fuels, whereas biofuels have better possibilities, e-LNG and e-Methanol need engines and systems capable bunker, store and consume such fuels. However, the decrease in penalties with their introduction raises the question whether there is any profitability when seen in conjunction with the EU tax regime. Additionally, with the flexibility of ‘pooling’ where Surplus can be sold to ‘deficit’ players, there is now a parallel cost expectation for the value of Surplus. This expectation cannot, however, be greater than the cost of abatement (CA) for the ‘deficit’ players.
This study intends to answer this question of profitability as a result of introduction of biofuels and RFNBO’s in the initial fuel mix. The next section elaborates the methodology and assumptions made to carry out these investigations followed by the results and discussion on insights gained.
Methodology and Assumptions:
The aim of this study is to evaluate the ‘cost of generating Surplus’ (B) (€/MT CO2eq) for the adopter of alternate fuels. This is computed for a given case of an existing fuel profile being substituted by increasing quantities of biofuel blend / RFNBO’s within the mix. For this investigation, the existing fuel profile is taken as 5000 MT of VLSFO (Very Low Sulphur Fuel Oil) annually in the EU region. Biodiesel (UCOME), BioLNG and RFNBO e-Methanol have been selected for substitutions in this study. The annual existing fuel profile of the vessel within the EU region will translate into an annual endurance energy (MJ). For a computed new fuel combination to qualify as a viable option, the total energy endurance for this new mix is kept between 100% to 101% of the original annual endurance energy to keep the computations withing tenable limits. Once a viable fuel combination is computed, its cost of fuel & climate tax (CFCT) is evaluated as per Equation (1). The CFCT of the existing fuel mix is then deducted from the CFCT of this new combination to arrive at the cost delta (∆cost). The cost delta is then divided by the Surplus generated to attain the cost of generating Surplus (B) as shown in Equation (2 & 3). A positive value of ∆cost and B indicates an increased expenditure due to the switch to alternative fuels, which will have to be recovered by selling the Surplus generated at this expected cost.
CFCT = Total fuel cost + EU ETS cost (1)
∆cost = (CFCT)Alt. fuel - (CFCT)Original fuel profile (2)
B = ∆cost / CB (3)
Additionally, the cost of generating Surplus (B) for the adopter is compared with the maximum cost of abatement that a deficit player (€/MT CO2eq) will be ready to pay. The maximum abatement for a deficit player can be evaluated as,
(CA)Deficit player = Fuel EU Penalty / CB (4)
Additionally, the proportion of alternate fuel / biofuel in the total fuel mix (P) is calculated as,
P = MassAlt. Fuel/Biofuel x 100/ (MassAlt. Fuel/Biofuel + MassLFO) (5)
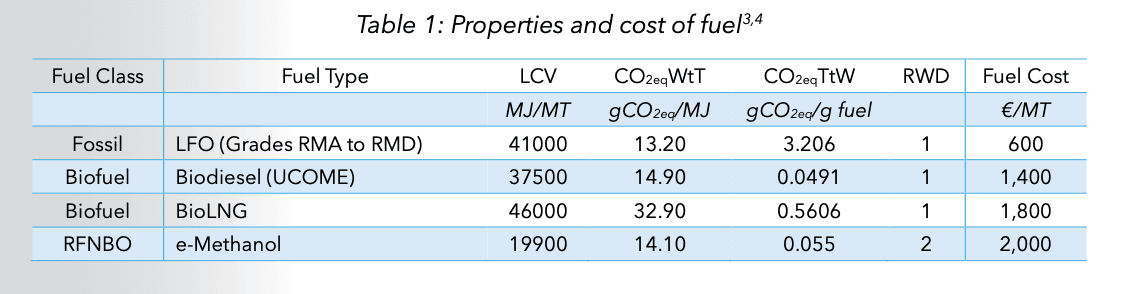
The computations of Fuel EU Penalty and EU ETS cost can be found in the respective regulations 1,2. The properties and cost of fuel considered are presented in Table 1. The costs of the fuel taken here do not include on-boarding and operational expenses for use of alternative fuels.
Results and Discussion:
Figure 1 shows ∆cost and Compliance Surplus as a function of Biodiesel proportion in the total fuel mix (P). As the iterations proceed with different combinations of LFO and Biodiesel keeping the energy within the selected endurance limits, various points are plotted for the ∆cost and corresponding Fuel EU Penalty. At 2.97% proportion of Biodiesel (point ‘X’), the Fuel EU Penalty becomes 0 and this value of P can be considered as the penalty mitigation point. All the other mixes greater than this proportion will generate a Surplus. Additionally, till this mitigation point, the extra cost in fuel bill remediates the Fuel EU penalty and as a result, no Surplus can be generated. Post the mitigation point, since there is no penalty left to mitigate, Surplus starts getting generated as seen in Figure 1.
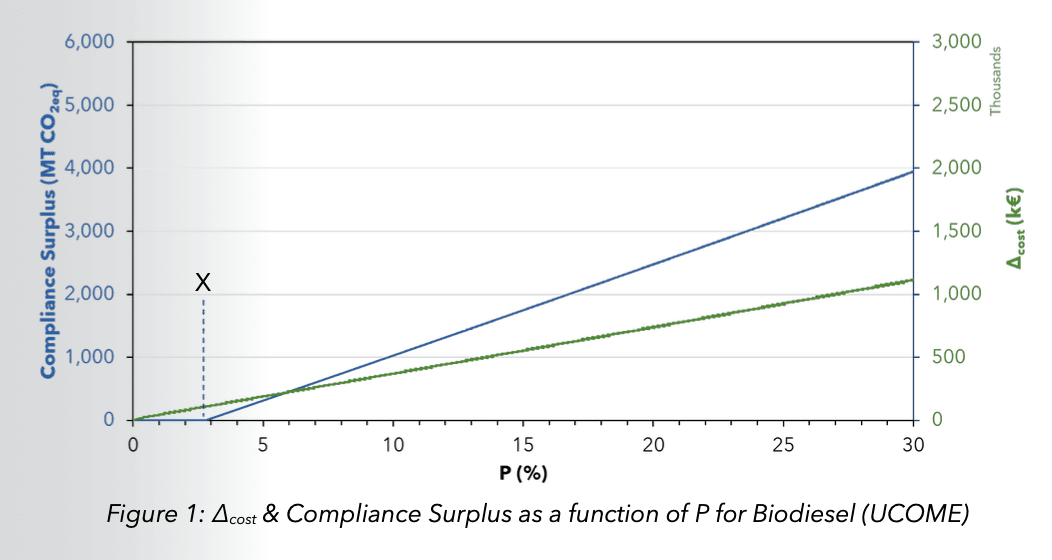
Figure 2 shows B and (CA)Deficit player as a function of Biodiesel proportion in the total fuel mix. (CA)Deficit player works out to be ~640 (€/MT CO2eq) for fossil fuels as per the calculations based on the regulation. Figure 2 also shows that the cost of generating Surplus (B) is not the same with change in fuel mix ratio. For lower quantities of Biodiesel, post the mitigation point, sufficient quantum of Surplus is not generated to justify the extra cost of the fuel bill. However, as P increases, the value of B settles at ~280 (€/MT CO2eq). It is also seen that there is a higher variability of B at lower biodiesel ratios, and this is reduced as P increases. This is attributed to the contribution of EU ETS that is computed based on CO2eqTtW. The difference in CO2eqTtW of LFO and Biodiesel is significant and that results in a higher sensitivity of EU ETS at low values of biodiesel in the fuel mix.
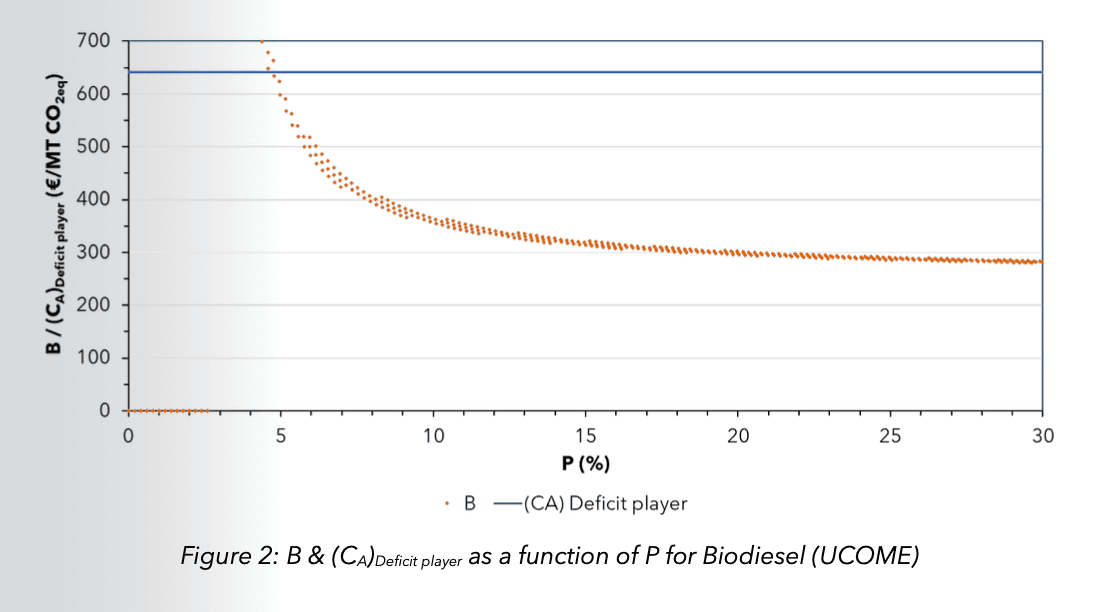
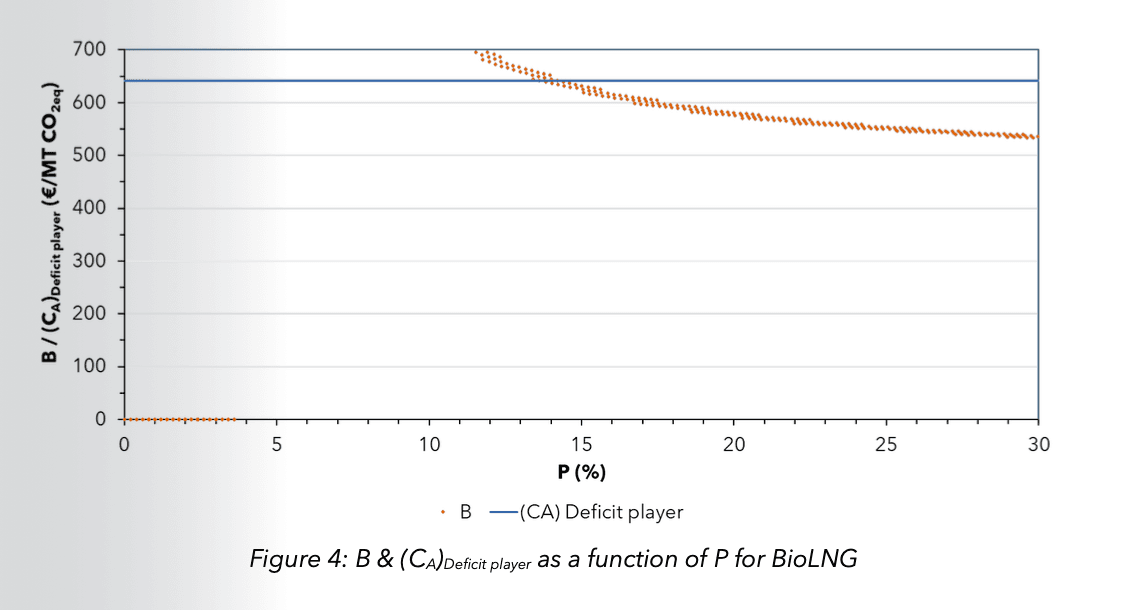
Figures 3 and 4 represent the ∆cost, Compliance Surplus and B, (CA)Deficit player as a function of BioLNG proportion in the total fuel mix (P). This option is open to ships with dual-fuel engines and LNG fuel infrastructure onboard. Similar trends as Biodiesel are observed with a difference in penalty mitigation point at 3.61% P. The fuel mix required for mitigation of penalty is more than Biodiesel (UCOME) which is attributed to higher WtT and TtW GHG emission factors of BioLNG. Similarly, the value for cost of generating Surplus (B) settles at ~530 (€/MT CO2eq) which is more than double the biodiesel (UCOME) price. This is ascribed to the fact that since the GHG emission factors are higher for BioLNG as compared to Biodiesel (UCOME), the quantum of Surplus generated is less. This reason coupled with a comparatively higher price of fuel raises the value of ‘B’.
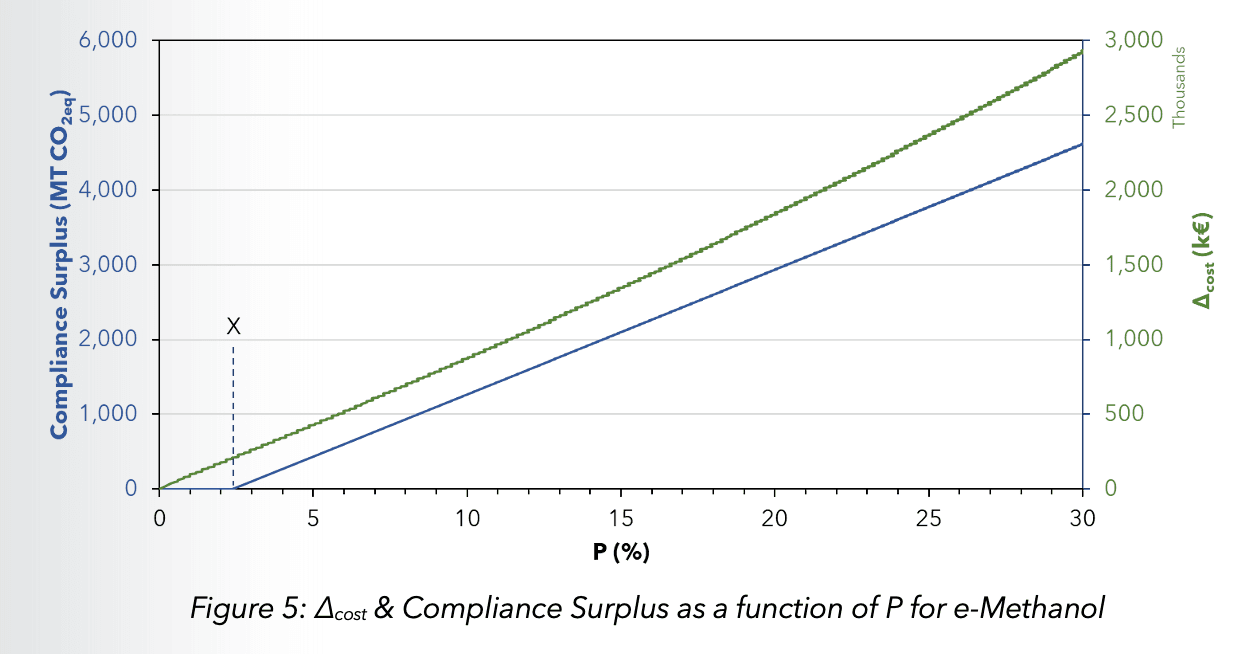
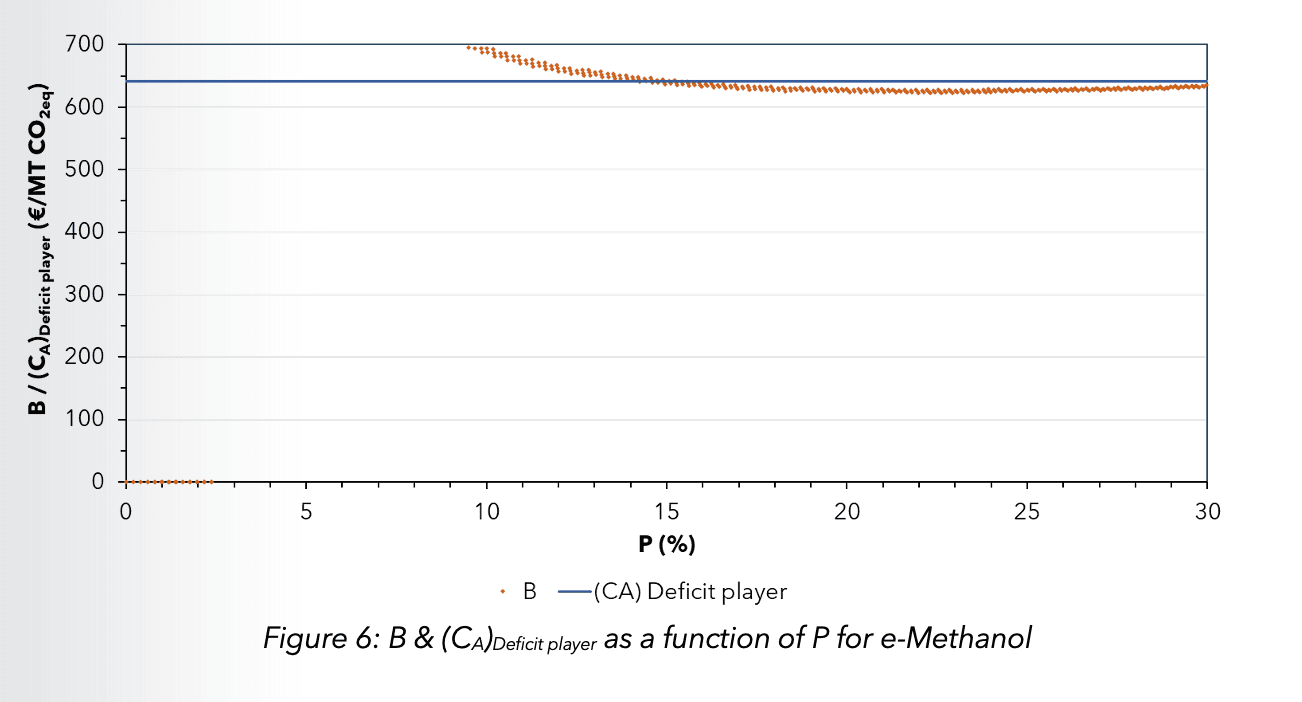
Figures 5 and 6 represent the ∆cost, Compliance Surplus and B, (CA)Deficit player as a function of e-Methanol proportion in the total fuel mix (P). This option is open to ships with dual-fuel engines and e-Methanol fuel infrastructure onboard. Similar trends as Biodiesel are observed with a difference in penalty mitigation point at 2.36% P. The mitigation of penalty is less than Biodiesel (UCOME) which is attributed to the reward factor of 2 provided by the regulation to promote the uptake of RFNBO’s. This also helps e-Methanol to generate large quantities of Surplus as compared to Biofuels. Similarly, the value for cost of generating Surplus (B) settles at ~630 (€/MT CO2eq) which is more than double the biodiesel (UCOME) price. This is due to the large difference in the current fuel prices of e-Methanol despite the capability of e-Methanol to generate large quantities of Surplus.
Thus, it is observed that the cost of generating surplus depends on multiple factors that include the properties of fuel like its LCV and GHG intensity as well as any reward factors that the regulation provides to the fuel type. It, however, is also dependent on the difference in price of the alternate fuel and fossil fuel (LFO, in this case). Thus, Figure 7 shows the variation of cost of generating Surplus with this difference in price. The trend of the cost of generating Surplus all the three alternative fuels selected show an increase in value with the increase in price difference of these fuels with LFO. The rate of increase in case of e-Methanol is lower than Biodiesel (UCOME) which is the result of the combination of lower LCV value and the reward factor of 2 provided to RFNBO’s by the regulation.
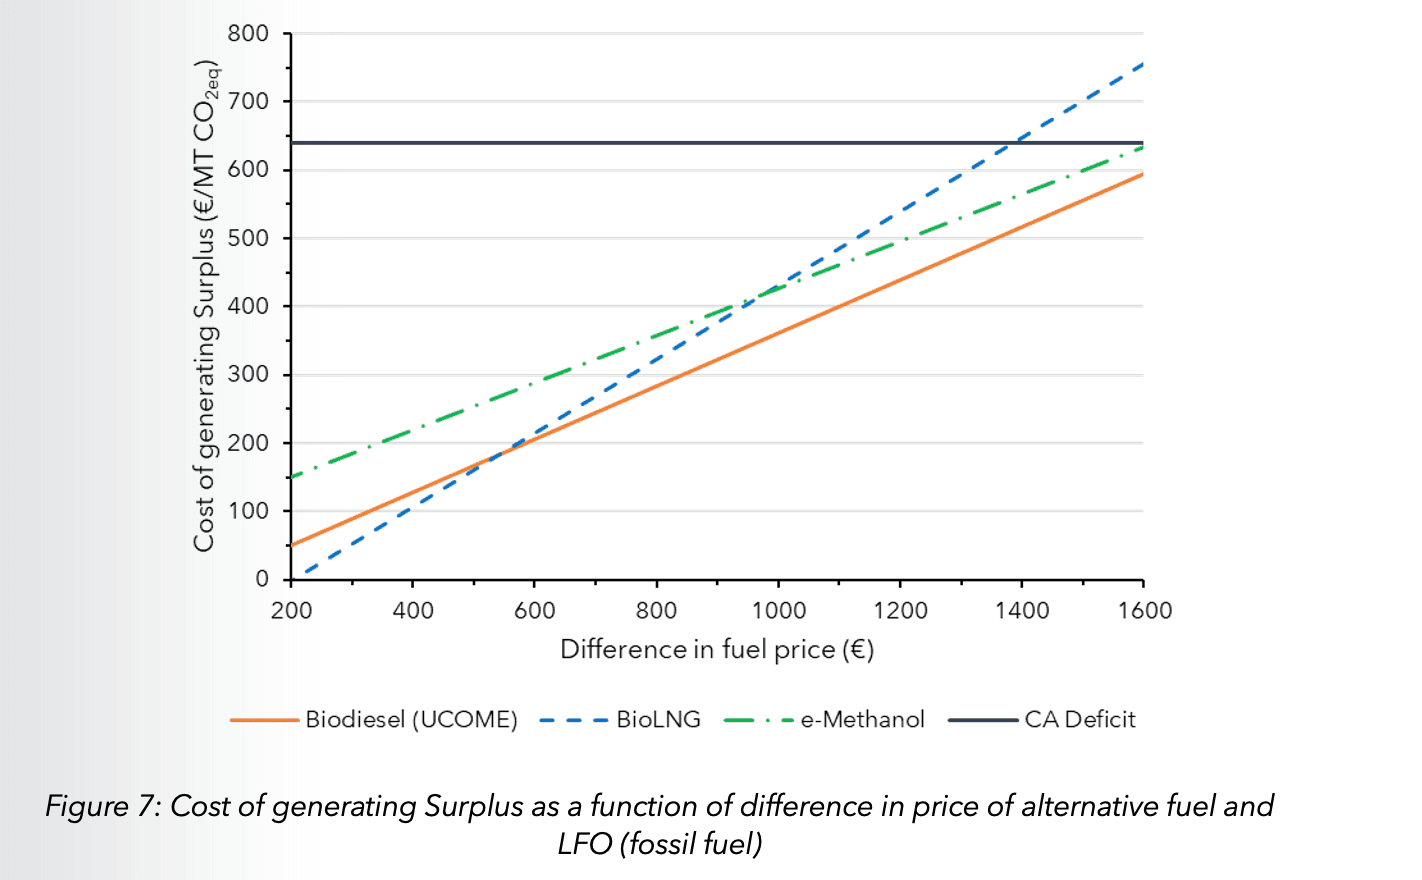
The rate of increase in the case of BioLNG is higher than Biodiesel (UCOME) which can be attributed to higher GHG intensity of the fuel itself. This higher intensity contributes to higher cost per unit increase in Surplus thereby resulting in a steeper slope. Additionally, at lower fuel price difference the cost of Surplus is lower for BioLNG as compared to Biodiesel (UCOME). This is a result of higher LCV values which results in utilization of lower quantity of fuel thereby keeping the cost of Surplus in check. However, as the difference in fuel price increases, this advantage is lost at ~550 €/MT. Furthermore, we can see that the advantage of adopting alternative fuel is lost as the cost of generating Surplus exceeds (CA)Deficit player, thereby making the option of paying penalty more attractive.
Conclusion
It is clear from this study that the cost of generating Surplus is not the same for all alternate fuels. It greatly depends on its properties and price as compared to conventional fuels. Biodiesel (UCOME) is the most economical and e-Methanol is the most expensive to generate Surplus in the current price scenario. It is also important to note that the adoption of alternate fuels needs to be strategized in advance due to its availability and shelf life. Its use should be maximized in EU voyages to account for the Surplus generated. It is also observed that the lower price of the alternate fuel will help in reducing the Surplus cost price and leave a larger margin to sell it thereby increasing its viability.
There are a few other variables in play as well. The above evaluated cost of generation of Surplus will not be valid if a LNG vessel is utilizing boil-off gas or the Owners may realize premium charter rates for such a vessel that adopts bio-Methanol / e-Methanol or they could be harnessing additionalities. Additionally, increased administrative burden, financing extra main engine spares, increased cost towards maintenance or breakdowns also impact the adoption and Surplus cost in the course of an alternative fuel switch.
This study is performed for ships that are currently operating on fossil fuel and wish to adopt alternative fuel in the upcoming year, 2025. For cases where the ship already utilizes these alternate fuels and wants to maximize their Surplus for monetary benefits, the conclusion of this study is not entirely applicable. Azolla can perform such a study on request. Please write to service@azolla.sg / support@azolla.sg for customized requests to navigate these EU regulations.
References
- REGULATION (EU) 2023/1805 OF THE EUROPEAN PARLIAMENT AND OF THE COUNCIL of 13 September 2023 on the use of renewable and low-carbon fuels in maritime transport, and amending Directive 2009/16/EC.
- COMMISSION IMPLEMENTING REGULATION (EU) 2022/996 of 14 June 2022 on rules to verify sustainability and greenhouse gas emissions saving criteria and low indirect land- use change-risk criteria.
- DIRECTIVE (EU) 2023/2413 OF THE EUROPEAN PARLIAMENT AND OF THE COUNCIL of 18 October 2023 amending Directive (EU) 2018/2001, Regulation (EU) 2018/1999 and Directive 98/70/EC as regards the promotion of energy from renewable sources, and repealing Council Directive (EU) 2015/652.
- COMMISSION DELEGATED REGULATION (EU) 2023/1185 of 10 February 2023 supplementing Directive (EU) 2018/2001 of the European Parliament and of the Council by establishing a minimum threshold for greenhouse gas emissions savings of recycled carbon fuels and by specifying a methodology for assessing greenhouse gas emissions savings from renewable liquid and gaseous transport fuels of non-biological origin and from recycled carbon fuels
Share
-
Contact us today to embark on a journey of discovery.optimization.maritime leadership.discovery.


